Post COVID-19, everything around has turned costlier on the back sustained inflation levels. From groceries to rent payments, bills seem to be on the rise, and like most products on the market, gas, unfortunately, isn’t an exception to these price hikes.
For Americans, gas expenditure is taking a toll, both mentally and on their bank balance, with highs of $3,700 a year being spent on gas. But how much cash exactly are Americans parting with in exchange for gas, and how does it compare to previous years?
Keep reading to find out more.
Key Insights
- The average American will drive around 14,263 miles each year or 1,189 miles per month, which results in a combined total of 3.26 trillion miles per year for all American drivers.
- The average American spends around $166 a month on gas, totaling to $1,992 a year.
- For comparison, brits spend on an average $1,437.30 and Australians spend $950 on fuel annually.
- The average price of gas per gallon in the US is now $3.60, which is $0.87 more than it cost five years ago.
- The average U.S. driver now spends 2.90% of their monthly income on their gas tank.
- Nearly one out of five gas stations in the US now charge more than $5 a gallon for gas.
- Americans living in Wyoming (5.15%), Mississippi (5.12%), and New Mexico (4.66%) spend the highest percentage of their monthly income on gas.
- The average price of gas is highest in California ($4.90) followed by Washington ($4.81).
- The most expensive vehicles to fill up with gas are the Ram 2500, Ford F-150 and the Ram 1500.
- The least expensive are the Honda Civic, Toyota Corolla Cross and Mazda CX-30.
- The price of gas is the third highest concern for the average American.
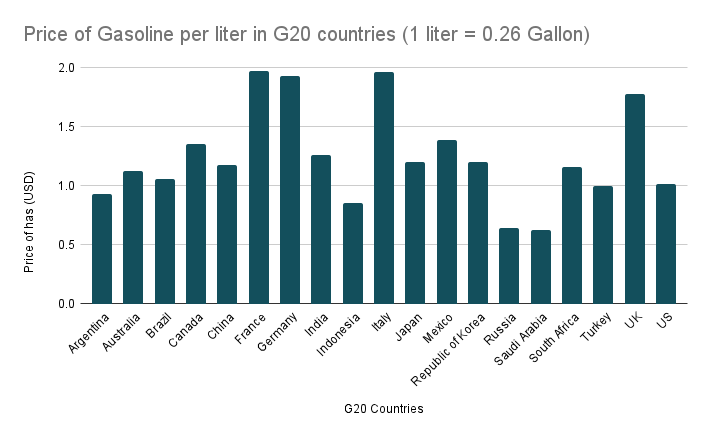
- Out of the G20 countries, America’s gas price is the 6th lowest.
America's current gas expenditure
The price of gas
Currently, the average price of gas per gallon in the United States is $3.60. While this is less than the $3.98 Americans were spending in 2022, it is a price increase of $0.87 per gallon within the last five years.
How much are Americans spending to fill up their fuel tanks?
According to the most recent expenditure data, the average American spends around $166 a month on gas, totaling just under $2,000 a year. This means that the average U.S. driver now spends 2.90% of their monthly income on their gas tank. And for American families, annual gas expenditure can reach a high of $5000 on average.
However, these figures can change depending on a number of factors, including:
- State
- Driving habits
- Lifestyle
- Vehicle type
As these factors could affect each American household differently, it’s said that, on average, Americans will usually spend between $150 to $200 on gas every month.
Gas expenditure by state
The average American will drive around 14,263 miles each year, totaling 1,189 miles monthly or about 39 miles per day. Combined, Americans drive about 3.26 trillion miles per year. Of course, these states will vary by person, state by state.
Gas prices differ in each state, so Americans living in one state could pay significantly less compared to Americans living in another. Alongside the price of gas, another factor that impacts gas expenditure is the number of miles driven. Americans living in smaller states or states where public transport is widely available will drive fewer miles compared to Americans living in big states where public transport is hard to come by and so will use less gas on average per month.
Who has the highest gas expenditure?
Despite some having lower gas prices, the states where Americans spend over 5% of their monthly income are the states that drive the most miles per month on average. These states include Wyoming and Mississippi, with residents spending 5.15% and 5.12% of their monthly income on gas.
Americans who live in Wyoming spend approximately $305 each month (equating to 5.15% of their monthly income) on gas, despite the price of gas costing less than the current average price of gas per gallon. In Wyoming, it costs $3.55 per gallon of gas, yet the US average per gallon is $3.60. Wyoming residents drive the most miles each month when compared to other states, driving approximately 2,148 miles per month.
But this doesn’t mean Wyoming has the highest gas price out of all the states. As of May 1st, 2023, the cost of gas per gallon in California is $4.90, making it the most expensive state to fill up your tank. Washington and Hawaii are next in line with high gas prices of $4.81 and $4.74 per gallon.
10 states where drivers spend the highest percentage of their monthly income on gas
| State | Average mileage per year (miles) | Average mileage per month | Avg. Gas Price | Average monthly gas spend ($) | Median Monthly Income | % of Monthly Income |
| Wyoming | 25,779 | 2,148 | $3.55 | $305.19 | $71,052 | 5.15% |
| Mississippi | 20,097 | 1,675 | $2.97 | $198.92 | $46,637 | 5.12% |
| New Mexico | 18,158 | 1,513 | $3.43 | $207.64 | $53,463 | 4.66% |
| West Virginia | 14,126 | 1,177 | $3.41 | $160.45 | $46,836 | 4.11% |
| Arkansas | 16,657 | 1,388 | $3.12 | $173.39 | $50,784 | 4.10% |
| Alabama | 17,699 | 1,475 | $3.11 | $183.55 | $56,929 | 3.87% |
| Kentucky | 16,143 | 1,345 | $3.31 | $178.29 | $55,629 | 3.85% |
| Missouri | 18,664 | 1,555 | $3.20 | $199.23 | $63,594 | 3.76% |
| Oklahoma | 17,232 | 1,436 | $3.21 | $184.32 | $60,096 | 3.68% |
Who has the lowest gas expenditure?
In the District of Columbia, residents spend $78 per month on gas, equalling just 1.03% of their overall spending. This is because residents also travel the least miles per month, driving approximately 530 miles each month with a current gas price of $3.68 per gallon.
As for the cheapest state to buy gas by the gallon, first place goes to Mississippi. As of May 1st, 2023, the price of gas per gallon in Mississippi is $2.97. Louisiana and Arkansas are next in line with low gas prices of $3.09 and $3.12 per gallon.
10 states where drivers spend the lowest percentage of their monthly income on gas
| State | Average mileage per year (miles) | Average mileage per month | Avg. Gas Price | Average monthly gas spend ($) | Median Monthly Income | % of Monthly Income |
| District of Columbia | 6356 | 530 | $3.68 | $78.02 | $90,640 | 1.03% |
| New Hampshire | 11176 | 931 | $3.49 | $129.89 | $88,841 | 1.75% |
| New Jersey | 11401 | 950 | $3.48 | $132.35 | $88,559 | 1.79% |
| Maryland | 12749 | 1062 | $3.43 | $145.88 | $97,332 | 1.80% |
| New York | 8997 | 750 | $3.69 | $110.76 | $72,920 | 1.82% |
| Rhode Island | 9975 | 831 | $3.50 | $116.44 | $74,982 | 1.86% |
| Massachusetts | 12064 | 1005 | $3.53 | $142.03 | $86,566 | 1.97% |
| Connecticut | 11122 | 927 | $3.63 | $134.75 | $80,958 | 2.00% |
| Colorado | 12204 | 1017 | $3.49 | $141.89 | $84,954 | 2.00% |
| Washington | 9849 | 821 | $4.81 | $158.06 | $87,648 | 2.16% |
Average Gas Expense, Gas Price and Percentage of monthly gas spend by State
| State | % of Monthly Income | Average monthly gas spend ($) | Average mileage per year (miles) | Average mileage per month | Median Monthly Income | Avg. Gas Price |
| Alabama | 3.87% | $183.55 | 17699 | 1475 | $56,929 | $3.11 |
| Alaska | 2.20% | $148.68 | 11077 | 923 | $81,133 | $4.03 |
| Arizona | 3.08% | $182.03 | 12728 | 1061 | $70,821 | $4.29 |
| Arkansas | 4.10% | $173.39 | 16657 | 1388 | $50,784 | $3.12 |
| California | 2.75% | $187.18 | 11464 | 955 | $81,575 | $4.90 |
| Colorado | 2.00% | $141.89 | 12204 | 1017 | $84,954 | $3.49 |
| Connecticut | 2.00% | $134.75 | 11122 | 927 | $80,958 | $3.63 |
| Delaware | 2.36% | $135.31 | 11965 | 997 | $68,687 | $3.39 |
| District of Columbia | 1.03% | $78.02 | 6356 | 530 | $90,640 | $3.68 |
| Florida | 3.13% | $155.83 | 13476 | 1123 | $59,734 | $3.47 |
| Georgia | 3.35% | $171.61 | 15747 | 1312 | $61,497 | $3.27 |
| Hawaii | 2.51% | $171.60 | 10869 | 906 | $82,199 | $4.74 |
| Idaho | 2.97% | $190.39 | 14372 | 1198 | $76,918 | $3.97 |
| Illinois | 2.35% | $154.90 | 11660 | 972 | $79,253 | $3.98 |
| Indiana | 3.52% | $206.05 | 16962 | 1414 | $70,190 | $3.64 |
| Iowa | 2.62% | $158.26 | 14087 | 1174 | $72,429 | $3.37 |
| Kansas | 2.60% | $164.32 | 15166 | 1264 | $75,979 | $3.25 |
| Kentucky | 3.85% | $178.29 | 16143 | 1345 | $55,629 | $3.31 |
| Louisiana | 3.44% | $164.02 | 15920 | 1327 | $57,206 | $3.09 |
| Maine | 2.77% | $164.26 | 13781 | 1148 | $71,139 | $3.58 |
| Maryland | 1.80% | $145.88 | 12749 | 1062 | $97,332 | $3.43 |
| Massachusetts | 1.97% | $142.03 | 12064 | 1005 | $86,566 | $3.53 |
| Michigan | 2.74% | $147.18 | 12120 | 1010 | $64,488 | $3.64 |
| Minnesota | 2.39% | $160.49 | 13799 | 1150 | $80,441 | $3.49 |
| Mississippi | 5.12% | $198.92 | 20097 | 1675 | $46,637 | $2.97 |
| Missouri | 3.76% | $199.23 | 18664 | 1555 | $63,594 | $3.20 |
| Montana | 3.56% | $192.82 | 15737 | 1311 | $64,999 | $3.68 |
| Nebraska | 2.50% | $162.69 | 14741 | 1228 | $78,109 | $3.31 |
| Nevada | 3.34% | $179.13 | 12590 | 1049 | $64,340 | $4.27 |
| New Hampshire | 1.75% | $129.89 | 11176 | 931 | $88,841 | $3.49 |
| New Jersey | 1.79% | $132.35 | 11401 | 950 | $88,559 | $3.48 |
| New Mexico | 4.66% | $207.64 | 18158 | 1513 | $53,463 | $3.43 |
| New York | 1.82% | $110.76 | 8997 | 750 | $72,920 | $3.69 |
| North Carolina | 3.21% | $168.13 | 15162 | 1263 | $62,891 | $3.33 |
| North Dakota | 3.38% | $194.12 | 16838 | 1403 | $68,882 | $3.46 |
| Ohio | 3.14% | $164.17 | 13632 | 1136 | $62,689 | $3.61 |
| Oklahoma | 3.68% | $184.32 | 17232 | 1436 | $60,096 | $3.21 |
| Oregon | 2.64% | $180.15 | 12159 | 1013 | $81,855 | $4.45 |
| Pennsylvania | 2.27% | $137.35 | 11286 | 940 | $72,627 | $3.65 |
| Rhode Island | 1.86% | $116.44 | 9975 | 831 | $74,982 | $3.50 |
| South Carolina | 2.94% | $153.07 | 14406 | 1200 | $62,542 | $3.19 |
| South Dakota | 2.78% | $171.21 | 14891 | 1241 | $73,893 | $3.45 |
| Tennessee | 3.34% | $172.79 | 16487 | 1374 | $62,166 | $3.14 |
| Texas | 2.91% | $163.65 | 15577 | 1298 | $67,404 | $3.15 |
| Utah | 2.89% | $210.87 | 15240 | 1270 | $87,649 | $4.15 |
| Vermont | 2.67% | $169.01 | 14107 | 1176 | $76,079 | $3.59 |
| Virginia | 2.23% | $149.12 | 13548 | 1129 | $80,268 | $3.30 |
| Washington | 2.16% | $158.06 | 9849 | 821 | $87,648 | $4.81 |
| West Virginia | 4.11% | $160.45 | 14126 | 1177 | $46,836 | $3.41 |
| Wisconsin | 3.07% | $179.21 | 14970 | 1248 | $69,943 | $3.59 |
| Wyoming | 5.15% | $305.19 | 25779 | 2148 | $71,052 | $3.55 |
| U.S. Average | 2.90% | $166.48 | 14,263 | 1189 | $71,538 | $3.60 |
Gas expenditure by vehicle
As gas is priced per gallon, the larger the fuel tank, the more it will cost to fill the car. For pickup truck owners, the price of filling up their tank would cost significantly more than a standard sedan.
The popular Ford F-150 pickup truck has a fuel tank that can contain 26 gallons, costing an average of $93.60 to fill up from empty. In 2021, filling the same car cost only $78.88 on average.
Due to the smaller-sized tanks, popular sedans such as the Honda Civic and Toyota Camry cost much less to fill up. A Honda Civic with a 12-gallon fuel tank used to cost around $37.62 to fill from empty back in 2021 and now will cost approximately $43.26. Similarly, a Toyota Camry with a 16-gallon fuel tank would cost around $47.93 to fill in 2021. In 2023, it will cost approximately $57.60 to fill its tank.
The most expensive vehicles to fill up with gas are the Ram 2500, Ford F-150 and the Ram 1500, while the least expensive are the Honda Civic, Toyota Corolla Cross and Mazda CX-30.
The changes in US gas prices over the years
It is no secret that gas prices have risen steadily over the years. In fact, since 2018, gas prices have increased by $0.87.
In 2020, gas prices dropped considerably to $2.19 due to the pandemic, as lockdowns and restrictions kept people indoors. As restrictions eased and America began to return back to normal, gas prices rose to $3.03, which was a $0.40 rise in price per gallon compared to pre-covid prices.
In early 2022, the Russian invasion of Ukraine began, which saw gas prices rise to an eye-watering $3.98. Now in 2023, the cost of gas has slowly declined to $3.60.
Current gas prices have now risen above the $4 per gallon mark, with nearly one out of five gas stations charging more than $5 a gallon for gas.
Back in 2020, gas took up just 2.56% of Americans’ overall spending, equating to around $131 a month or approximately $1568 per year. In 2023, gas expenditures now account for 3.2% of the average American’s total spending.
How does the US’ gas expenditure compare to other countries?
Surprisingly, America’s rising gas prices are lower when compared to other countries. Looking at the current price (in USD) of gasoline per liter in the G20 countries, America’s $1.014 is the 6th lowest. It currently costs $0.96 more per liter of gas in France than it does in the United States.
Despite this, America’s higher-than-usual gas prices are having a significant impact on Americans’ mental health. In 2023, the price of gas is one of the top concerns of American adults, with 87% saying they are concerned about the price of gas.
The price of gas is the third highest concern of adult Americans, with the price of groceries (89%) and energy costs (88%) topping the list by a mere 1-2%.
Final thoughts
As you can see from the statistics listed above, Americans are spending a significant amount of dollars filling their tanks when compared to previous years. Although the US isn’t the country with the highest-priced gas, it is certain that the inflated price of gas is causing concern for most American adults and households.
Looking at the fluctuations year on year, however, gas prices are relatively better than they were in 2022. With gas prices peaking in 2022, it is hopeful that the average price of gas will continue to lower gradually throughout the next several years, but we will just have to wait and see what the future holds.
Methodology
For the research, we got the state-wise number from license drivers and total yearly mileage from FHWA. We divided the state mileage by the number of licensed drivers in the state to get the average mileage per driver. We then considered the average fuel efficiency of light-duty vehicles (25 mpg) from BTS.gov and divided it by the average mileage per driver in the state that we found before to come up total gas consumed.
Next, we sourced the latest gas prices from AAA (13/06/2023) and multiplied them by the total gas consumed to get state-wise monthly and yearly gas expenses per driver.
Finally, we divided state-wise total monthly and yearly gas spend with state-wise median household income data from US Census Bureau to determine the percentage of income Americans are spending on gas.
